You can easily implement chart visualization of data in your ORIGAM application. Any screen section can add a Chart View.
You can define the following types of charts:
Cartesian Charts
Cartesian charts visualize data using the Cartesian coordinate system. The points are shown on the Horizontal Axis (the X axis) and the Vertical Axis (the Y axis). It is possible to add a field reference for the Z axis. You can select between the Column Series and the Line Series.
Pie Charts
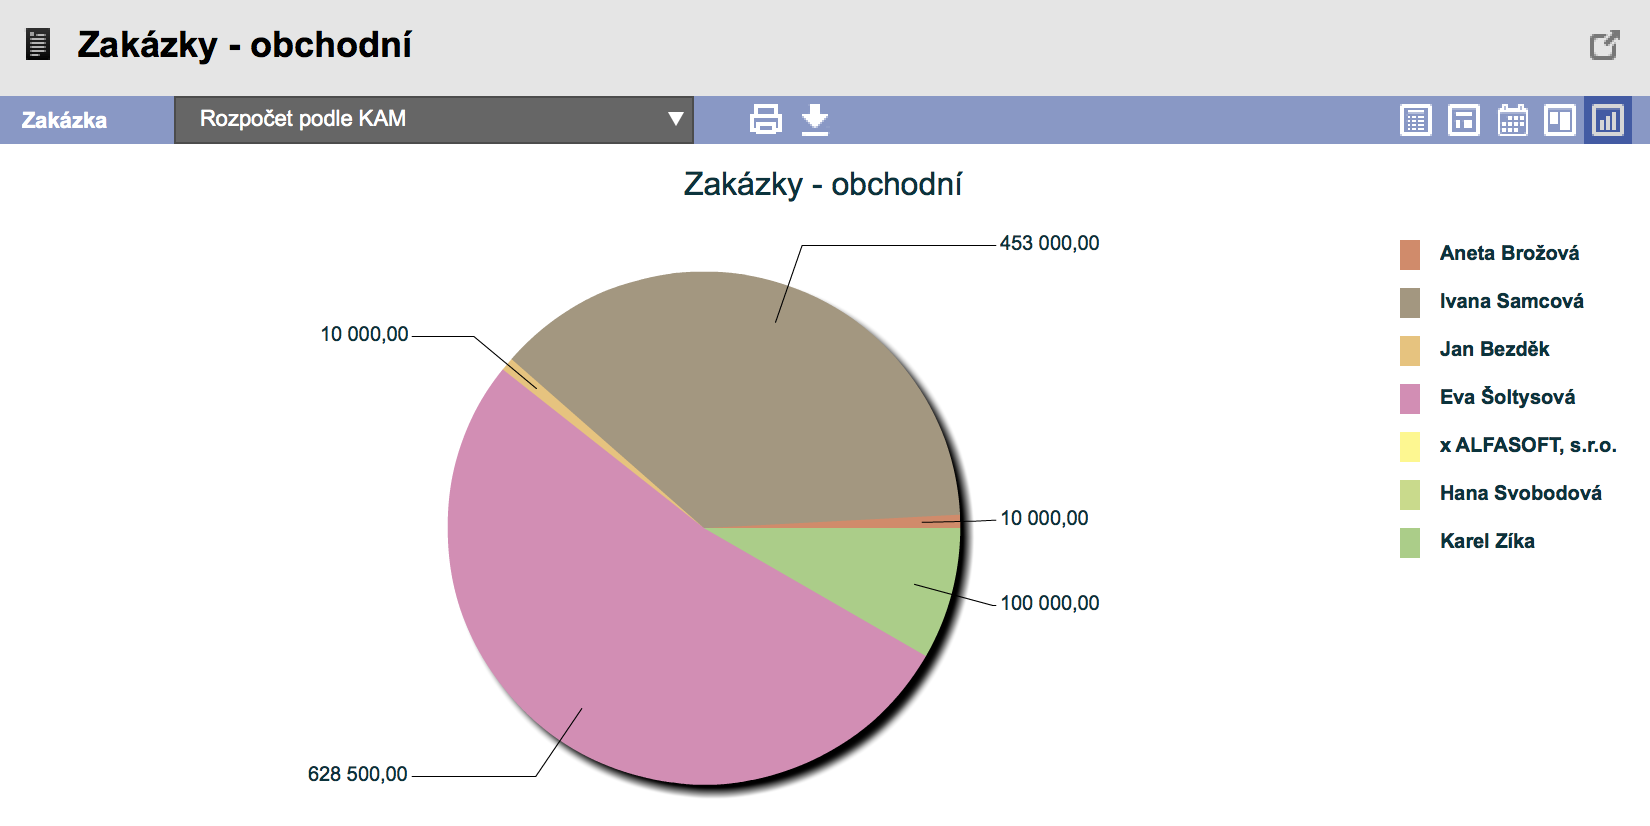
A pie chart illustrates a numerical proportion of a whole, by dividing a circle into segments or slices.
This is an example of a pie chart: