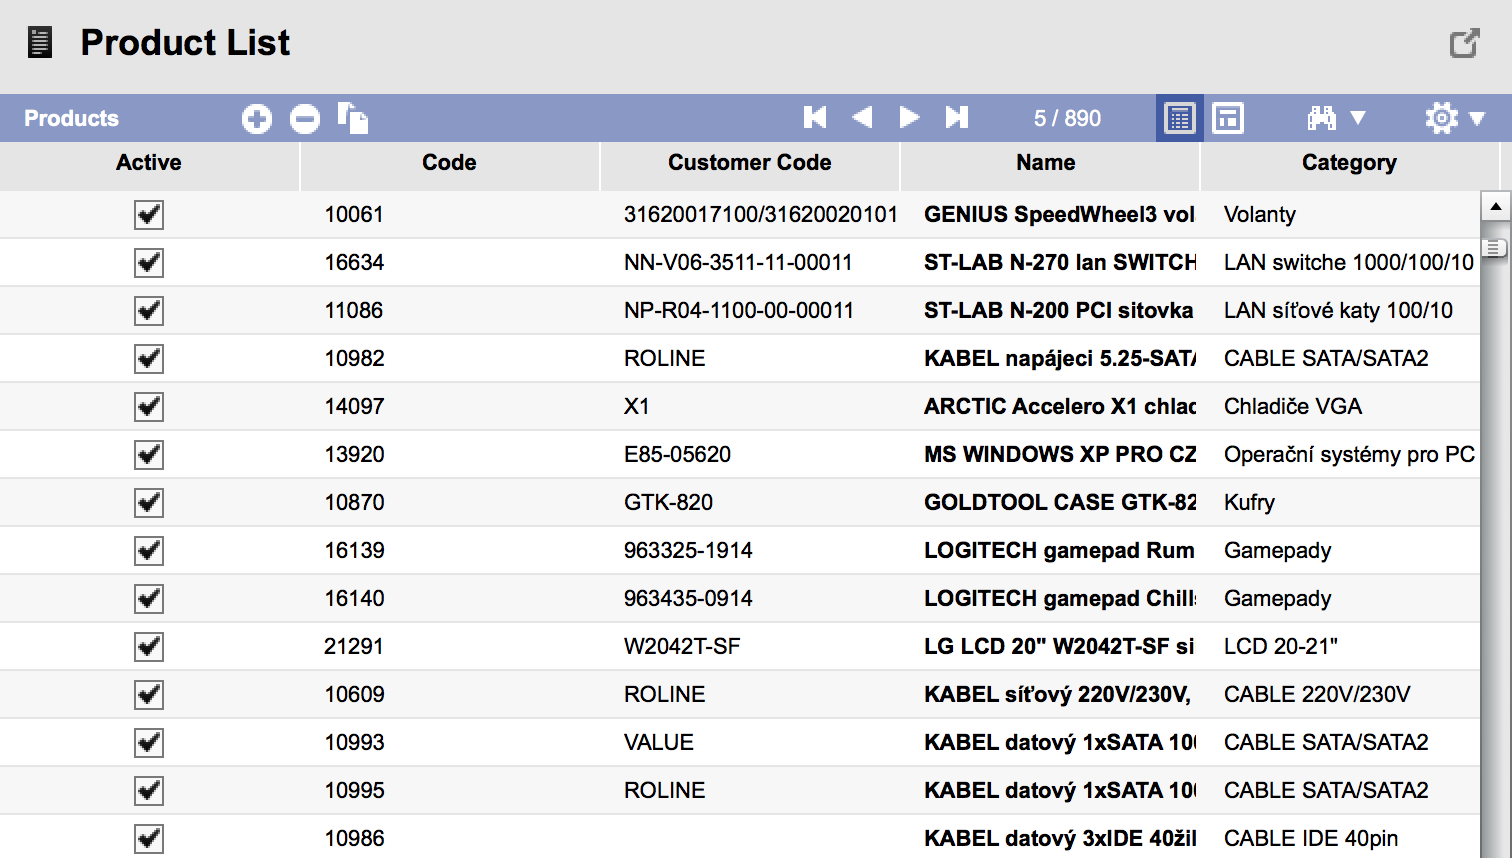
In a table view, you can see multiple rows in a spreadsheet-like setup. You can easily
- add and edit data,
- sort,
- filter,
- store filters,
- store view configurations,
- group,
- have totals and subtotals,
- freeze columns,
- export to Excel.
As you can see you can edit data both in the table view and the detail view. The user can decide what is easier and switch to the right view. The selection is stored so next time the user opens the screen the last used view is selected automatically.
Filtering data in the table view will automatically filter data in detail, chart, map, calendar and Kanban views so you can easily analyze different sets of data.
You can switch to any other available view at any time.