Chart View Feature
Using the chart view you can see data visualized to different chart types. You can define multiple different charts for the same data (the user can switch using the drop-down box).
Filtering data in the table view will automatically filter data in the chart view so you can easily analyze different sets of data.
You can switch to any other available view at any time.
Example
These are the examples of the different chart types you can define:
- Cartesian charts (lines, bars)
- Pie charts
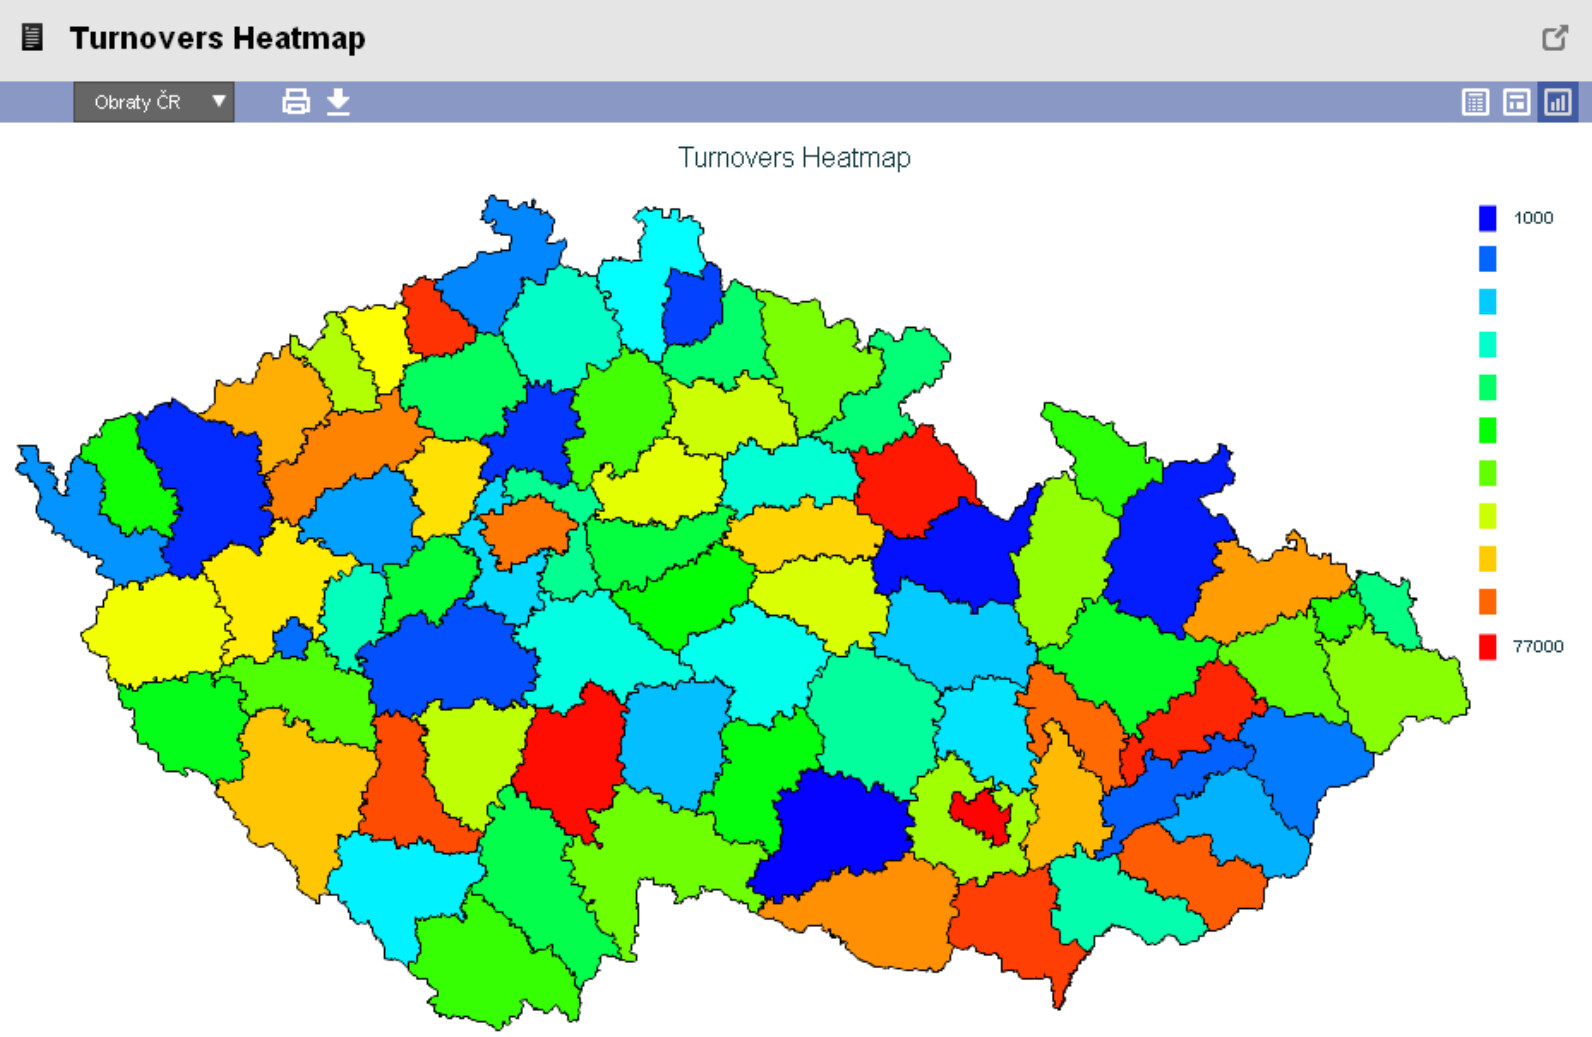
- Heat map SVG charts
Cartesian Charts
This is an example of a line chart: