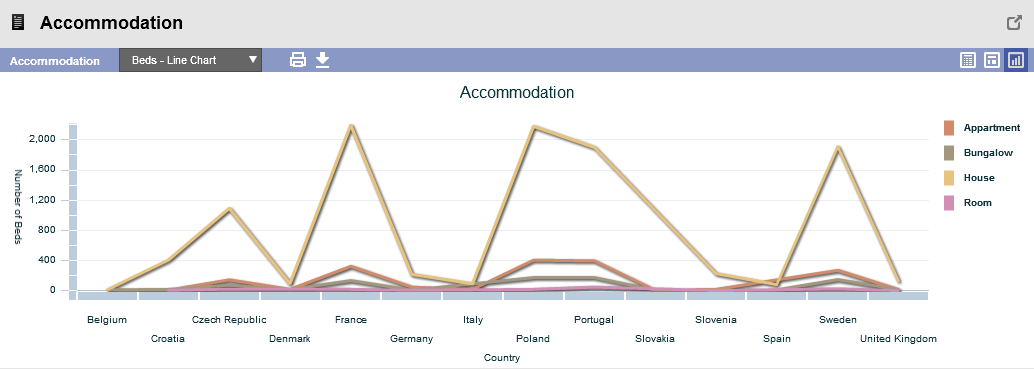
Line series is a type of a Cartesian chart. A line chart displays data as a series of data points connected with a straight line. It is used to display value changes over a period of time.
This is an example of a line chart:
ATTRIBUTES
| Name | Name of the element. |
| Aggregation | Type of the aggregation used on the values of the Vertical (Y) axis. Possible values are None, Count, Sum, Average, Minimum, Maximum and CumulativeSum. |
| Caption | Name describing the values on the Z axis. |
| ColorsLookup | |
| Field | Enter the name of the field that contains the values displayed on the Vertical (Y) axis and that is used for the aggregation. |
| Type | How will the line connecting the values be displayed. Possible types are Segment, Curve, Horizontal, Vertical, Step and ReverseStep. |
| ZAxisField | Enter the name of the field that contains the values displayed on the Z axis. |