Mini Profiler
Mini Profiler was introduced in the 2025.9 version and generally speaking, it is suitable for modelers to debug performance issues, for beginners to learn how ORIGAM works, and it may also help in documentation.
It is a simple .NET library we use for client request and SQL profiling in ORIGAM. This feature can help you to optimize your models by showing you what SQL queries take the longest and their details. Based on that information you can add indexes or turn views to materialized views for example.
We recommend using the profiler only in a development environment, where problems are detected and corrected, and the solutions are then transferred to production. When used in a production environment, the profiler could expose some sensitive data, which is why it is not safe and not recommended.
Mini Profiler monitors all web requests, including custom UI and, in the future, API and individual queries in detail. The profiler is primarily used to monitor SQL queries to the DB, but it can also be used for anything else that you hook into it. Currently, due to dependency injection, profiling of transformations and rules does not work, but this is also planned to be implemented.
The profiler automatically maps all requests to the server; the breakdown is only for SQL, and it is not possible to select only certain types of requests for mapping. This also affects performance, as all records are stored in memory and written to the log.
The log, which is reset along with the server, contains the activity of all working users, is available to all authorized users, and is the same for everyone. For this reason, it is not recommended for use in production, but only for development.
In Github, Mini Profiler is in the origam / mini-profiler branch.
More details about Mini Profiler you can find on its website.
Profiler Setup
To enable Mimi Profiler set this property in appsettings.json to true:
"MiniProfiler": { "Enabled": "true" },
To enable it in docker container, add this into the .env file:
MiniProfiler__Enabled=true
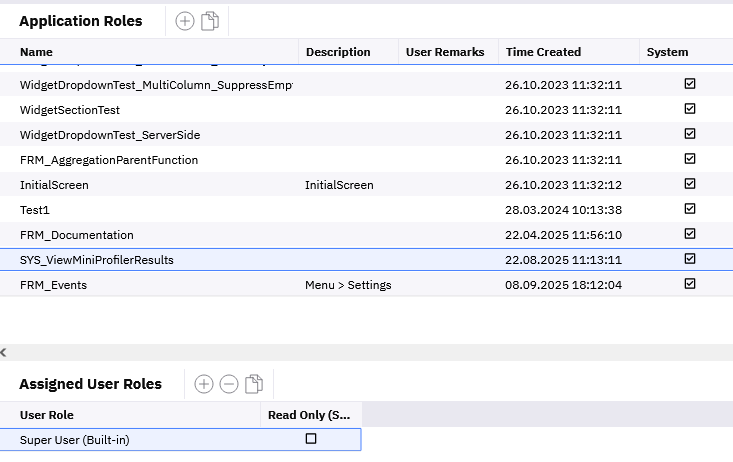
The application role SYS_ViewMiniProfilerResults is already automatically added to the Super User user role. In order to allow access to the profiler to the Origam users, you either assign them the Super User user role or create a new user role with this application role assigned.
Once enabled, open a screen in the client application and then navigate to
{base address}/profiler/results-index
Where the base address is the address where your client application runs. So for example: https://localhost:44357/profiler/results-index
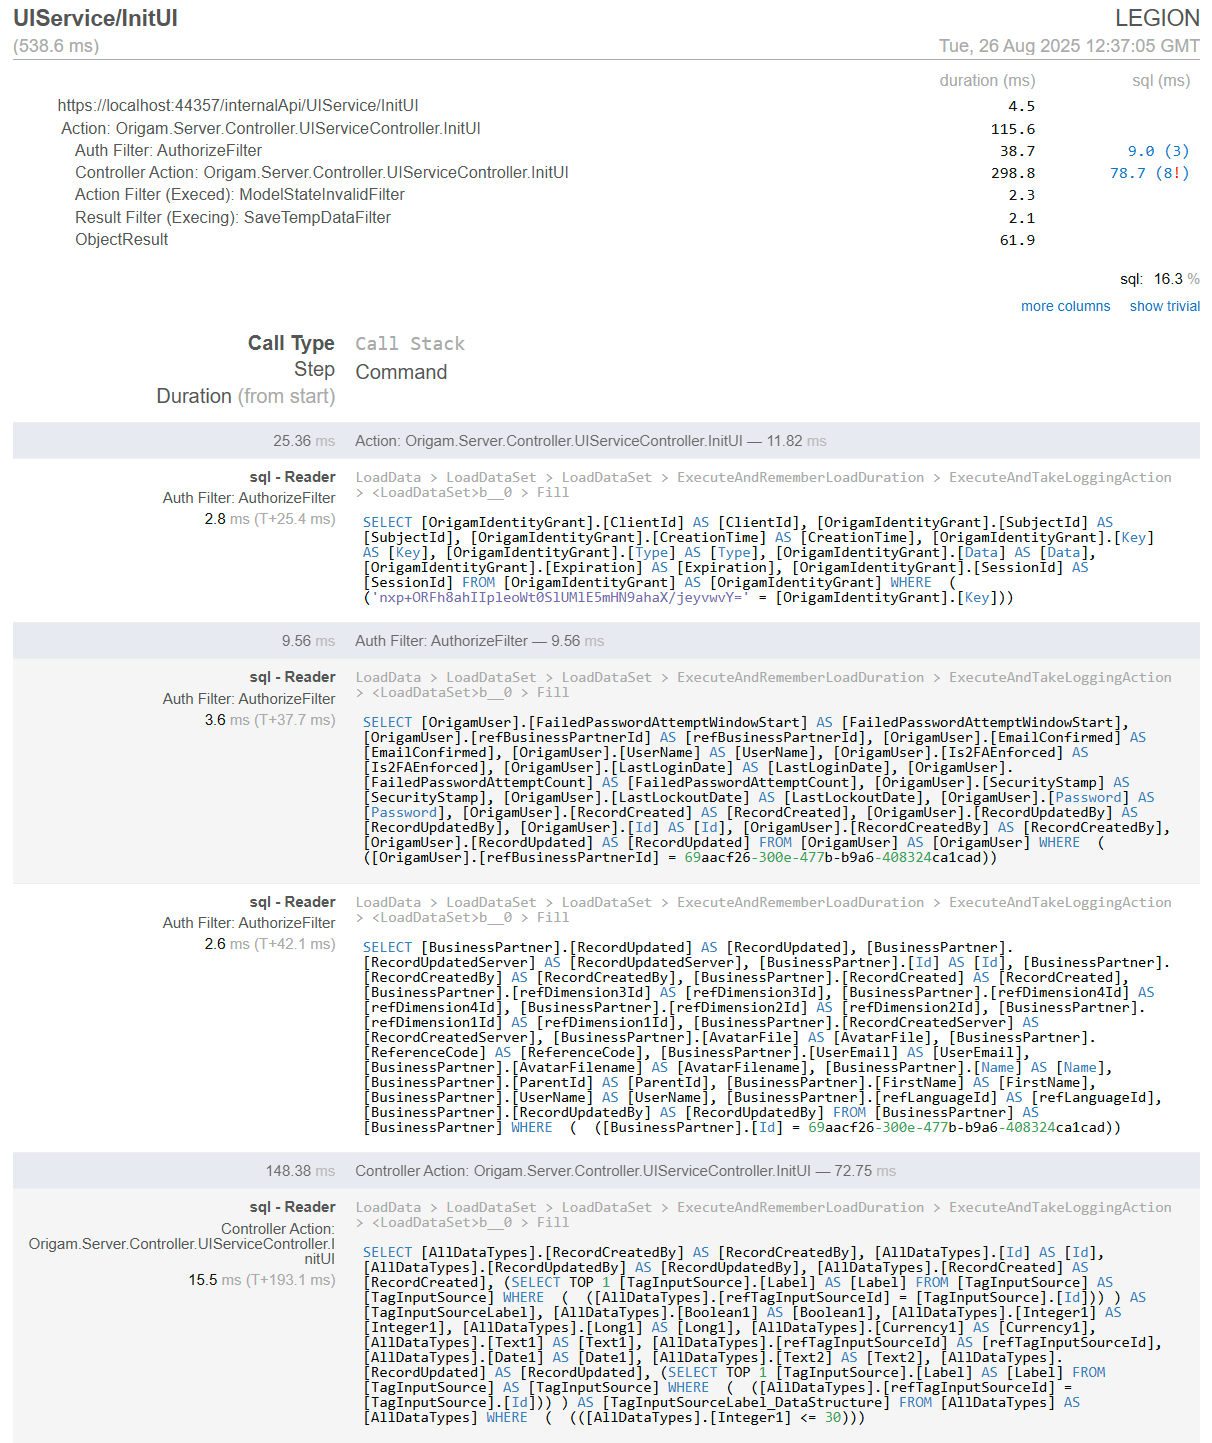
After you navigate there you will see list of executed requests.
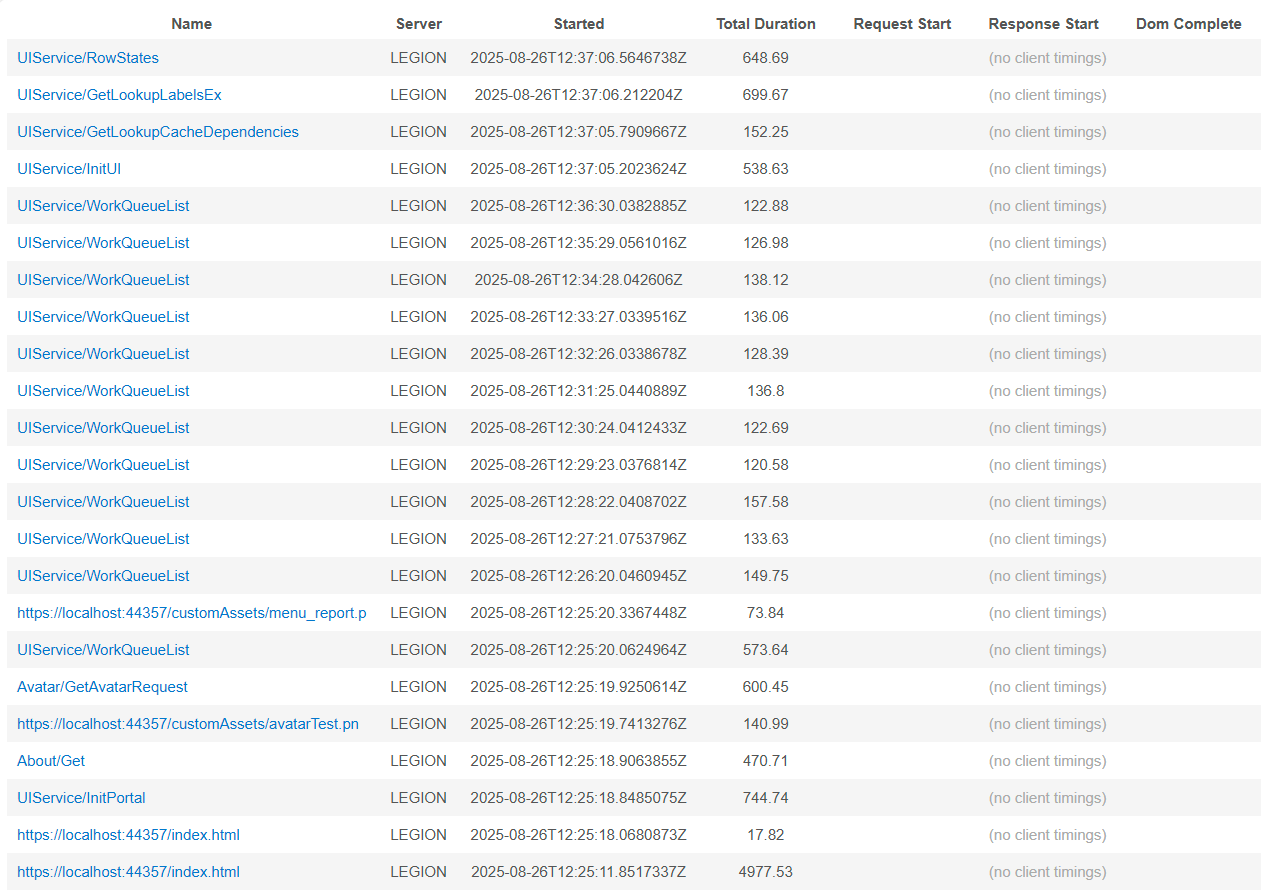
You can inspect the requests by clicking on them. Detail of the request will appear with the executed SQL and timing.